
A few months ago, we released our new open-source project: a Grafana plugin for monitoring Kubernetes, which we called DevOpsProdigy KubeGraf. The source code of the plugin is available in a public repository on GitHub. And in this article, we want to tell you the story of the plugin’s creation, the tools we used, and the pitfalls we faced in the development process. So, let's do it!
Part 0 — Introductory: How Did We Get There?
The idea to write our own plugin for Grafana came to us out of the blue. For over 10 years, our company has been monitoring web projects of various complexity. Over that time, we have built up a lot of expertise, gathered many interesting case studies, and gained vast experience with different monitoring systems. At some point, we thought, "Is there a magic tool for monitoring Kubernetes? One that you can just install and forget about?" The industry standard for monitoring K8s is, of course, a combo of Prometheus + Grafana. There is a large set of various ready-made solutions for this stack, including prometheus-operator, plus a set of kubernetes-mixin and grafana-kubernetes-app dashboards. We considered grafana-kubernetes-app to be the most interesting option, but it hadn't been supported for more than a year. Besides, it wasn't able to work with new versions of node-exporter and kube-state-metrics. So, we asked ourselves: "Why don't we do it on our own?"
So, here are the ideas we decided to implement in our plugin:
• visualization of an "app map": a convenient presentation of apps in a cluster, where they are grouped by namespaces, deployments, etc.
• visualization of links: "deployment — service (+ports)"
• visualization of the application cluster’s distribution by the cluster's nodes
• collection of metrics and information from multiple sources: Prometheus and K8s API server• monitoring of the infrastructure (CPU time, memory, disk subsystem, network) as well as the app's logic (health-status pods, the number of available replicas, information on liveness/readiness tests)
Part 1: What Is "A Plugin for Grafana"?
From a technical point of view, a plugin for Grafana is an Angular controller stored in the Grafana data directory (/var/grafana/plugins/<your_plugin_name>/dist/module.js); it can be uploaded as a SystemJS module. A plugin.json file should also be located in this directory, and the file should contain all meta information about your plugin: name, version, type of plugin, links to the repository/site/license, dependencies, and so on.

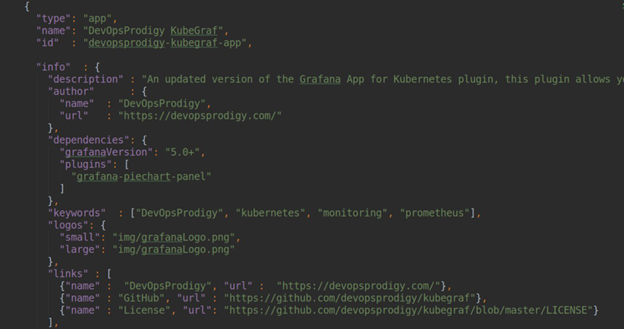
As you can see in the above screenshot, we have specified plugin.type = app. Plugins for Grafana can be of three types:
panel: The most common type of plugin, this is a panel for visualizing any metrics, and is used to build multiple dashboards.
datasource: A plugin connector to any data source (for example, Prometheus-datasource, ClickHouse-datasource, ElasticSearch-datasource).
app: A plugin that allows you to build your own frontend application inside Grafana, create your own HTML pages, and manually access the datasource to visualize different data.
Plugins of other types (datasource, panel) and various dashboards can be used as dependencies.
JavaScript or TypeScript can be used as the programming language (we chose TypeScript for our plugin). You can find blanks for hello-world plugins of any type here. In the repository there is a large number of starter packs (there's even an experimental example of the plugin on React) with pre-installed and pre-configured crawlers.
Part 2: Prepping the Local Environment
To work on the plugin you definitely need a Kubernetes cluster with all the pre-installed tools: prometheus, node-exporter, kube-state-metrics, and grafana. The environment should be set up quickly, easily, and naturally, and Grafana should be mounted directly from the developer's machine to enable a hot reload of the data directory.
In our opinion, the most convenient way of working with a local Kubernetes instance is minikube. Our next step is to install a combo of Prometheus + Grafana with the help of prometheus-operator. Here you will find an article describing how to install prometheus-operator on minikube. To enable persistence, you must set the parameter persistence: true in the file charts/grafana/values.yaml, add your own PV and PVC, and specify them in the parameter persistence.existingClaim.
Our final startup script of minikube looks like this:
minikube start --kubernetes-version=v1.13.4 --memory=4096 --bootstrapper=kubeadm --extra-config=scheduler.address=0.0.0.0 --extra-config=controller-manager.address=0.0.0.0 minikube mount /home/sergeisporyshev/Projects/Grafana:/var/grafana --gid=472 --uid=472 --9p-version=9p2000.L
Part 3: Direct Development
Object model
As part of the preparation process for developing the plugin, we decided to describe all the underlying entities of Kubernetes we will work with in the form of TypeScript classes: pod, deployment, daemonset, statefulset, job, cronjob, service, node, and namespace. Each of these classes inherits from the common class BaseModel, which describes a constructor, a destructor, and methods to update and toggle visibility. In each of the classes, nested relationships with other entities are described; for example, a list of pods for the entity of deployment type.
With the help of getters and setters, we can display or set the desired metrics of the entities in a convenient and readable form. For example, here is the formatted output of allocatable cpu nod:
get cpuAllocatableFormatted(){ let cpu = this.data.status.allocatable.cpu; if(cpu.indexOf('m') > -1){ cpu = parseInt(cpu)/1000; } return cpu; }Pages
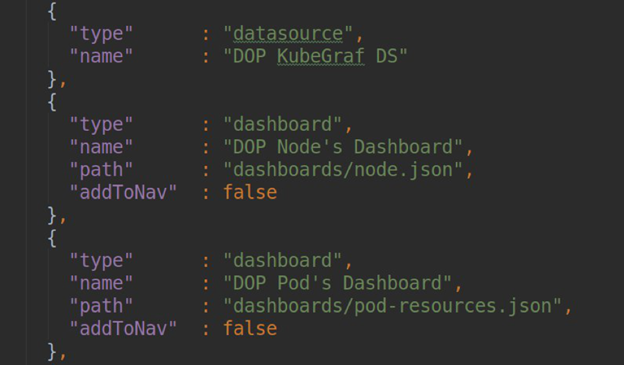
The list of all the pages of our plugin is originally described in our plugin.json under the dependencies section:
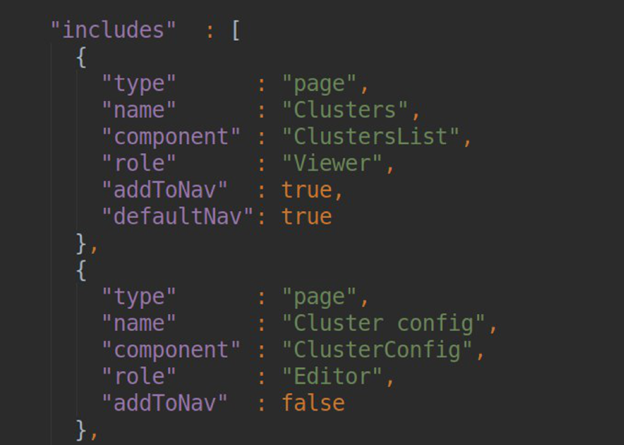
In the block for each page we should specify the PAGE NAME (it will then be converted to a slug, and that's how the page will be available), the name of the component responsible for the page (the list of components will be exported to module.ts), the user role that can work with the page, and navigation settings for the side panel.
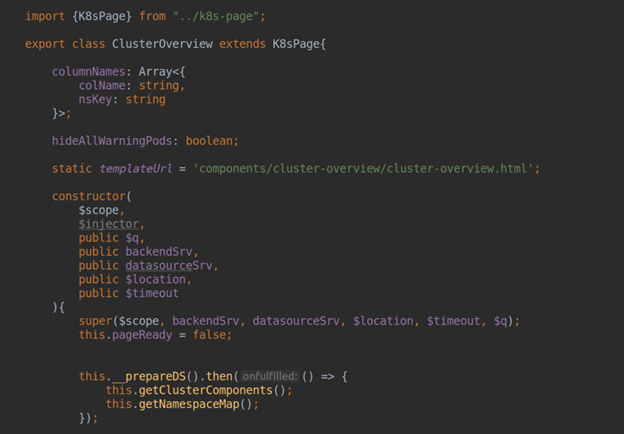
In the component responsible for the page, we should set a templateUrl containing the path to the HTML file with markup. Inside the controller, using dependency injection, we can get access to two important Angular services:
• backendSrv — a service providing interaction with the Grafana APIserver;
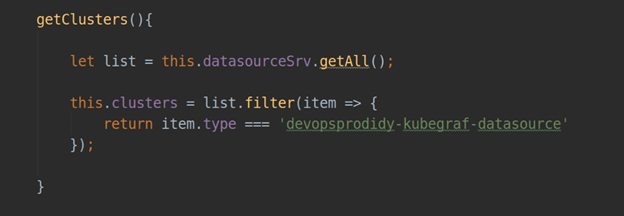
• datasourceSrv — a service providing local interaction with all the data sources installed in your Grafana (e.g., .getAll() returns a list of all installed datasources, and .get(<nаme>) returns an object instance of a specific datasource).
Part 4: Data source
In Grafana, a data source represents exactly the same plugin as all the others: it has its own entry point module.js, a file with metadata called plugin.json. When developing a plugin with type = app we can communicate both with existing data sources (for example, prometheus-datasource), and with our own data sources, which we can store directly in the plugin directory (dist/datasource/*) or install as a dependency. In our case, the data source is supplied with the plugin code. Also, a template config.html and controller ConfigCtrl are required for the configuration page of a data source, while a data source controller will implement the logic of your data source.
In the KubeGraf plugin, from the point of view of the user interface, the data source is a Kubernetes cluster that has the following features (source code available here):
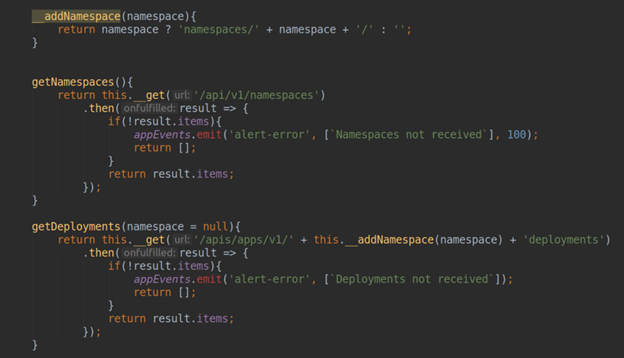
• collecting data from the K8s API server (getting the list of namespaces, deployments, etc.)
• proxying requests in prometheus-datasource (which is selected in the plugin settings for each specific cluster), and formatting the answers to use the data both in the static pages and in the dashboards
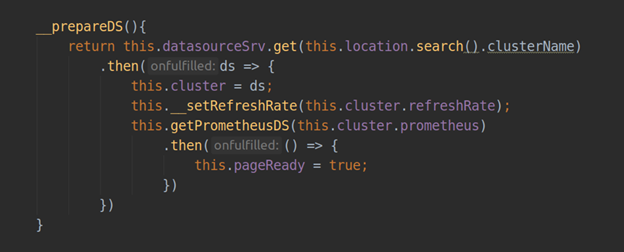
• updating the data in static pages of the plugin (with a fixed-time refresh rate);
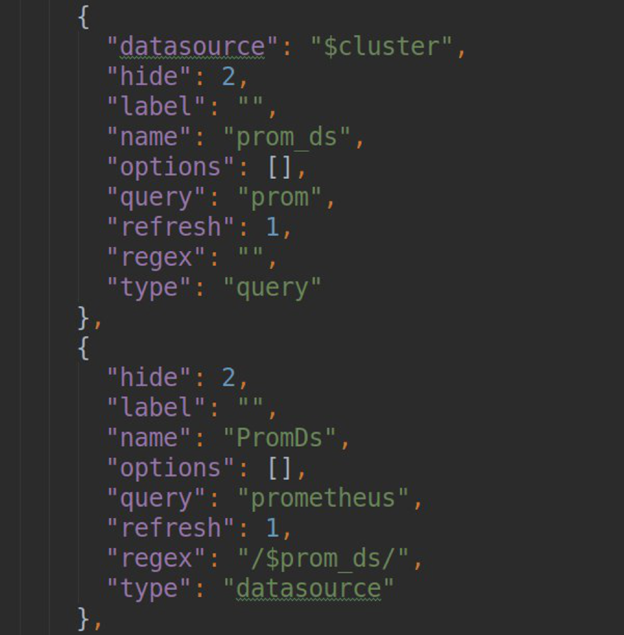
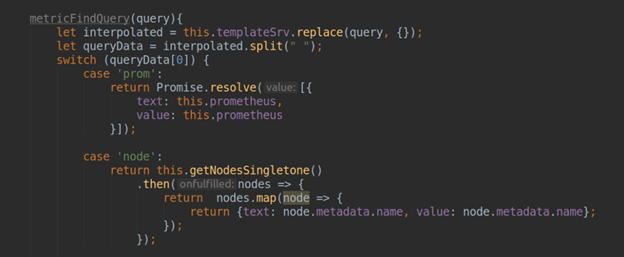
• processing requests to fill out a template sheet in grafana-dashboards (method .metriFindQuery())
• performing a connection test with the final K8s cluster:
testDatasource(){ let url = '/api/v1/namespaces'; let _url = this.url; if(this.accessViaToken) _url += '/__proxy'; _url += url; return this.backendSrv.datasourceRequest({ url: _url, method: "GET", headers: {"Content-Type": 'application/json'} }) .then(response => { if (response.status === 200) { return {status: "success", message: "Data source is OK", title: "Success"}; }else{ return {status: "error", message: "Data source is not OK", title: "Error"}; } }, error => { return {status: "error", message: "Data source is not OK", title: "Error"}; }) }Another interesting thing here, from our point of view, is implementing an authentication and authorization mechanism for the data source. As a rule, we can use a built-in feature of Grafana, datasourceHttpSettings, right out of the box to configure access to the final HTTP data source. We just need to indicate the URL and the basic authentication/authorization settings: login and password, or client-cert/client-key. In order to implement the ability to configure access using a bearer token (the de-facto standard for K8s), we had to doctor it up a bit.
To solve this issue, you can use the built-in tool, Grafana "Plugin Routes" (read more on the official documentation page). In the settings of our datasource, we can declare a set of routing rules to be processed by the Grafana proxy server. For example, for each individual endpoint, you can put headers or URLs, and create a template if you like; the data for that can come from the fields jsonData and secureJsonData (to store passwords or tokens in encrypted form). In our example, queries of the type /__proxy/api/v1/namespaces will be proxied at a URL of the type <your_K8s_api_url>/api/v1/namespaces with the header Authorization: Bearer.

Of course, to work with the K8s API server, we need a user with read only access. You can find access manifests to create one in the plugin's source code.
Part 5: Release
As soon as you write your own plugin for Grafana, you'll definitely want to share it as open source. For that purpose, you can use the Grafana plugin library, available here: grafana.com/grafana/plugins.
If you want your plugin to be available in an official store, you should make a PR and put it in this repository, then add to the repo.json file the following content:
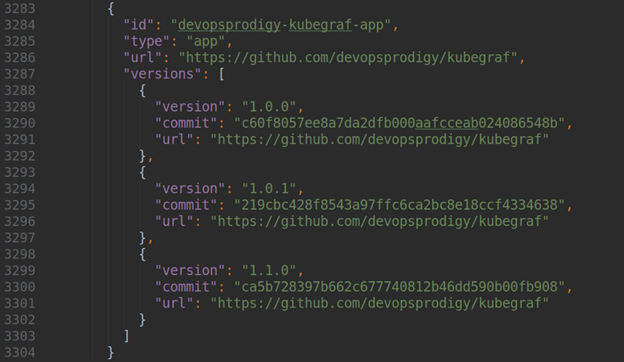
where version is the version of your plugin, url is a link to the repository, and the commit is a hash of the commit where that version of the plugin will be available.
And finally, you will see a beautiful sight:
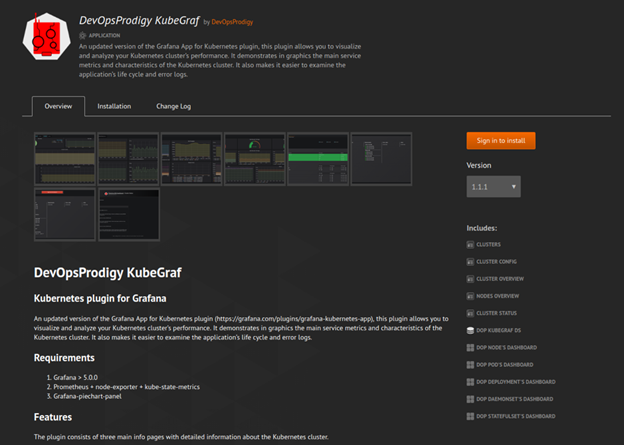
The data for this page will be automatically collected from your Readme.md, Changelog.md, and the plugin.json file with the plugin description.
Part 6: In Conclusion? Not Yet.
Even though we’ve released the plugin, we’re definitely not done developing it. What are we doing now? We’re working on perfecting the monitoring of node cluster resource utilization, and crafting some new features to improve the UX. Also, we’re carefully processing tons of feedback, which we received after the plugin was installed both by our clients and those who requested it on github (if you share your issue or pull request there, we'll be super happy :-) ).
We hope this article will help you understand Grafana (it’s such a wonderful tool), and maybe even write your own plugin. Thank you!