We’re excited to present our latest in-house solution! DevOpsProdigy KubeGraf is a Grafana plugin that allows you to monitor K8s. It’s an updated, advanced version of the official Grafana K8s App plugin.
The official plugin lacked a few significant options that we implemented in KubeGraf:
- Authentication and authorization via bearer token to work with the K8s API to install the plugin with read-only access for cloud K8s solutions, including Amazon AWS, Google Cloud Platform, DigitalOcean, etc.
- Support for the latest K8s versions, from K8s 1.12 to K8s 1.17
- Support for the latest versions of Node exporter, kube-state metrics (to create dashboards)
- Monitoring of StatefulSets
Plugin’s key features:
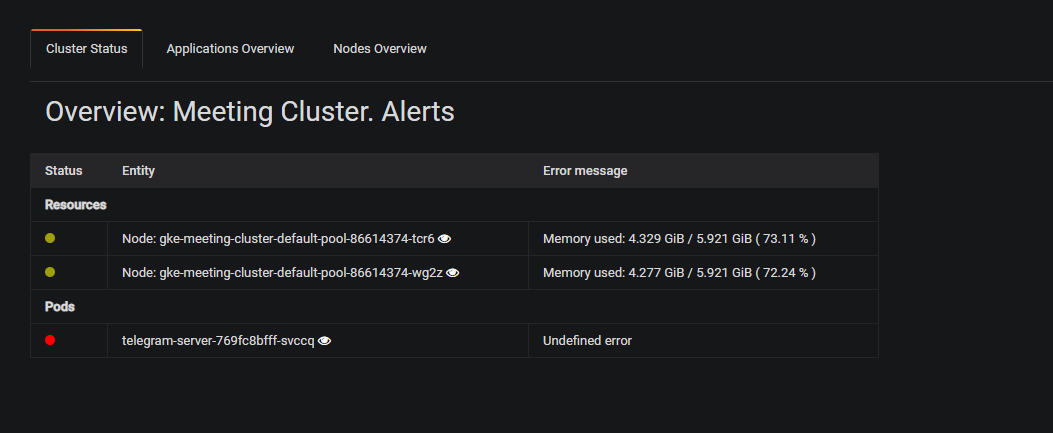
Cluster Health status:
Provides a brief overview of any serious issues happening with your K8S cluster such as heavy resource usage, pod readiness/liveness, etc.
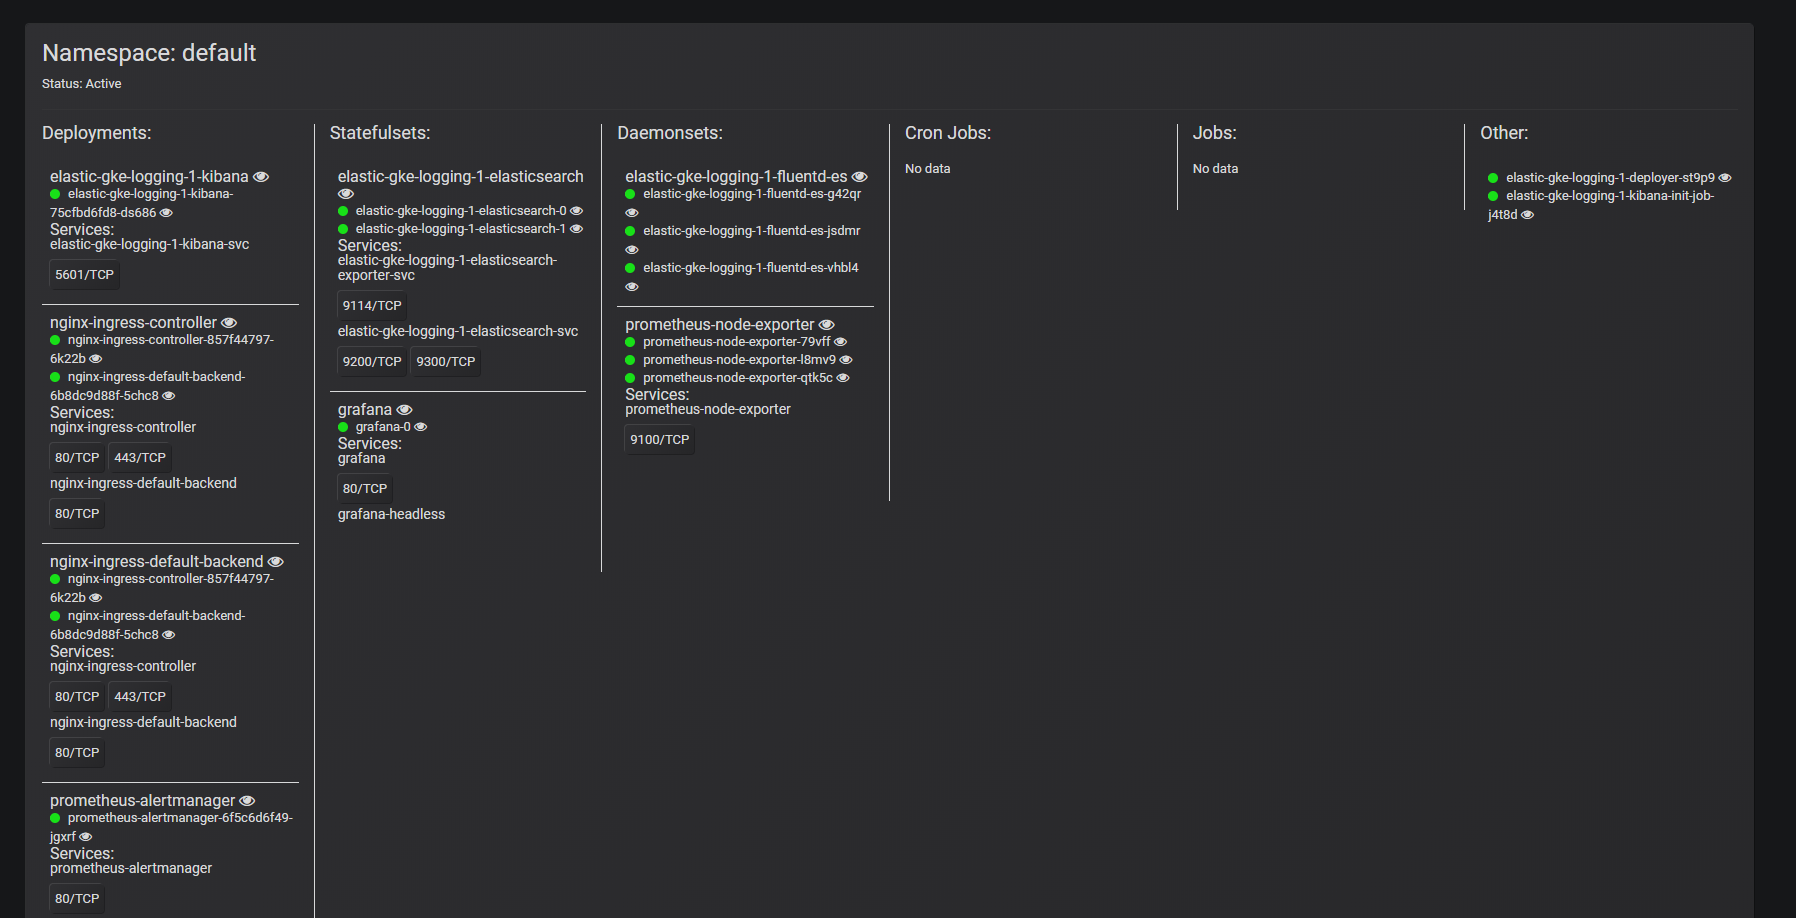
Applications Overview:
Detailed Service Map describing current information on Deployments/Statefulsets/Daemonsets/Cron Jobs/Jobs/Services and the relations between them, arranged by Deployments and Namespaces in one place.
Nodes Overview:
A visual presentation of cluster metrics and cluster map:
- A map of pod distribution according to cluster’s nodes, node info and details about cluster node resources
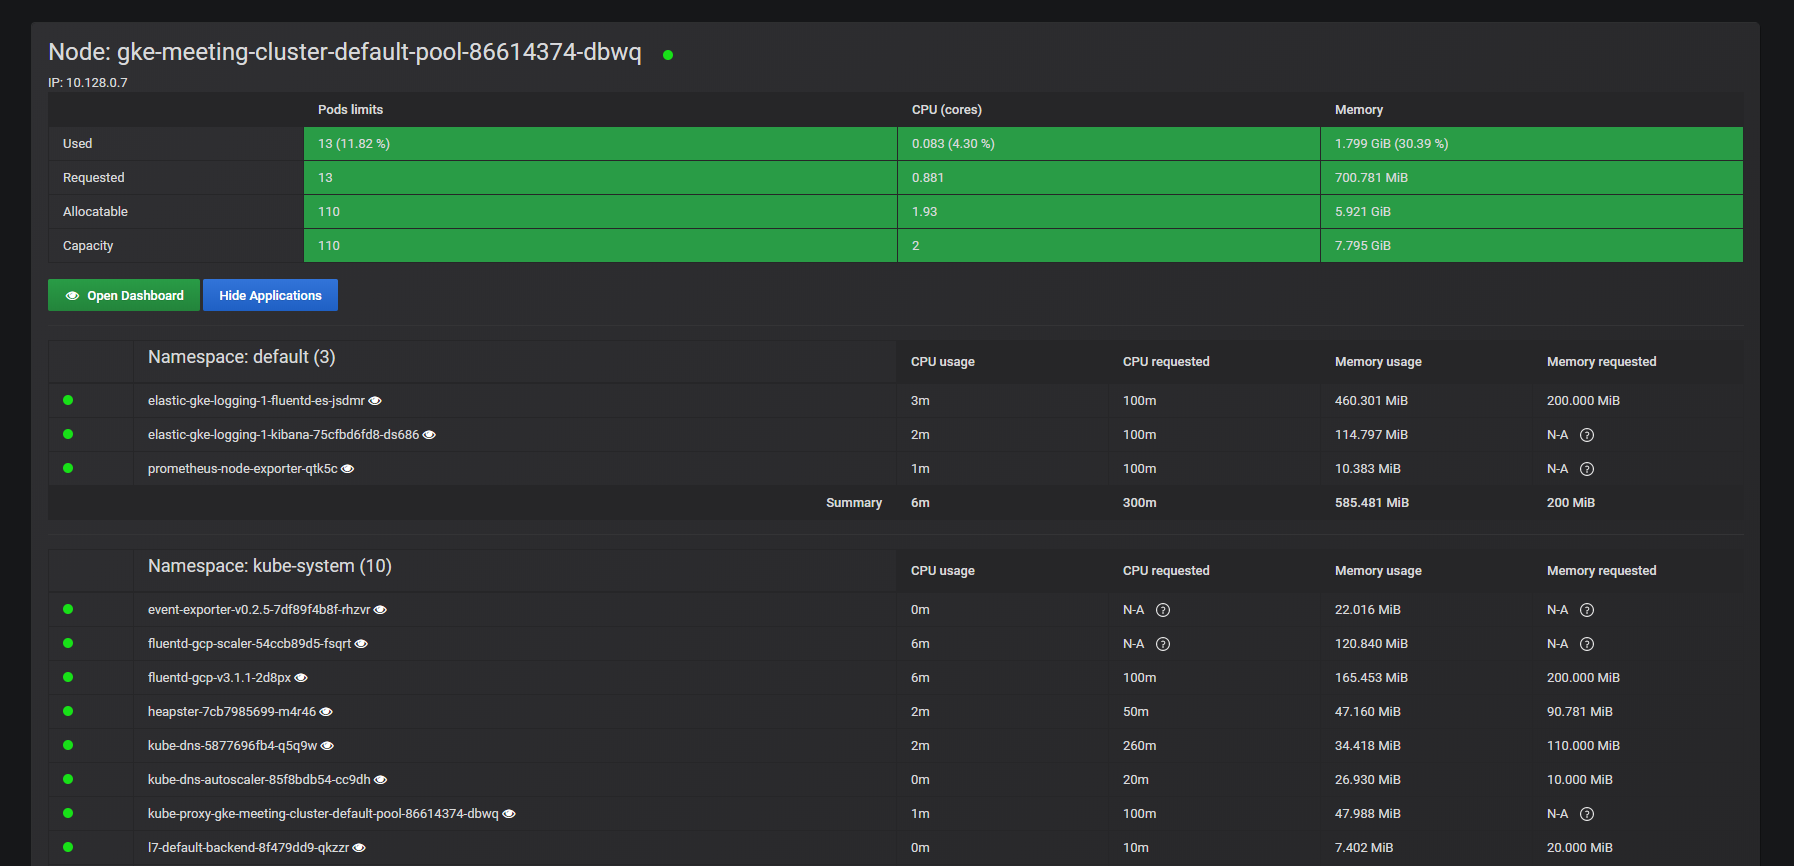
- Node statistics and graphs
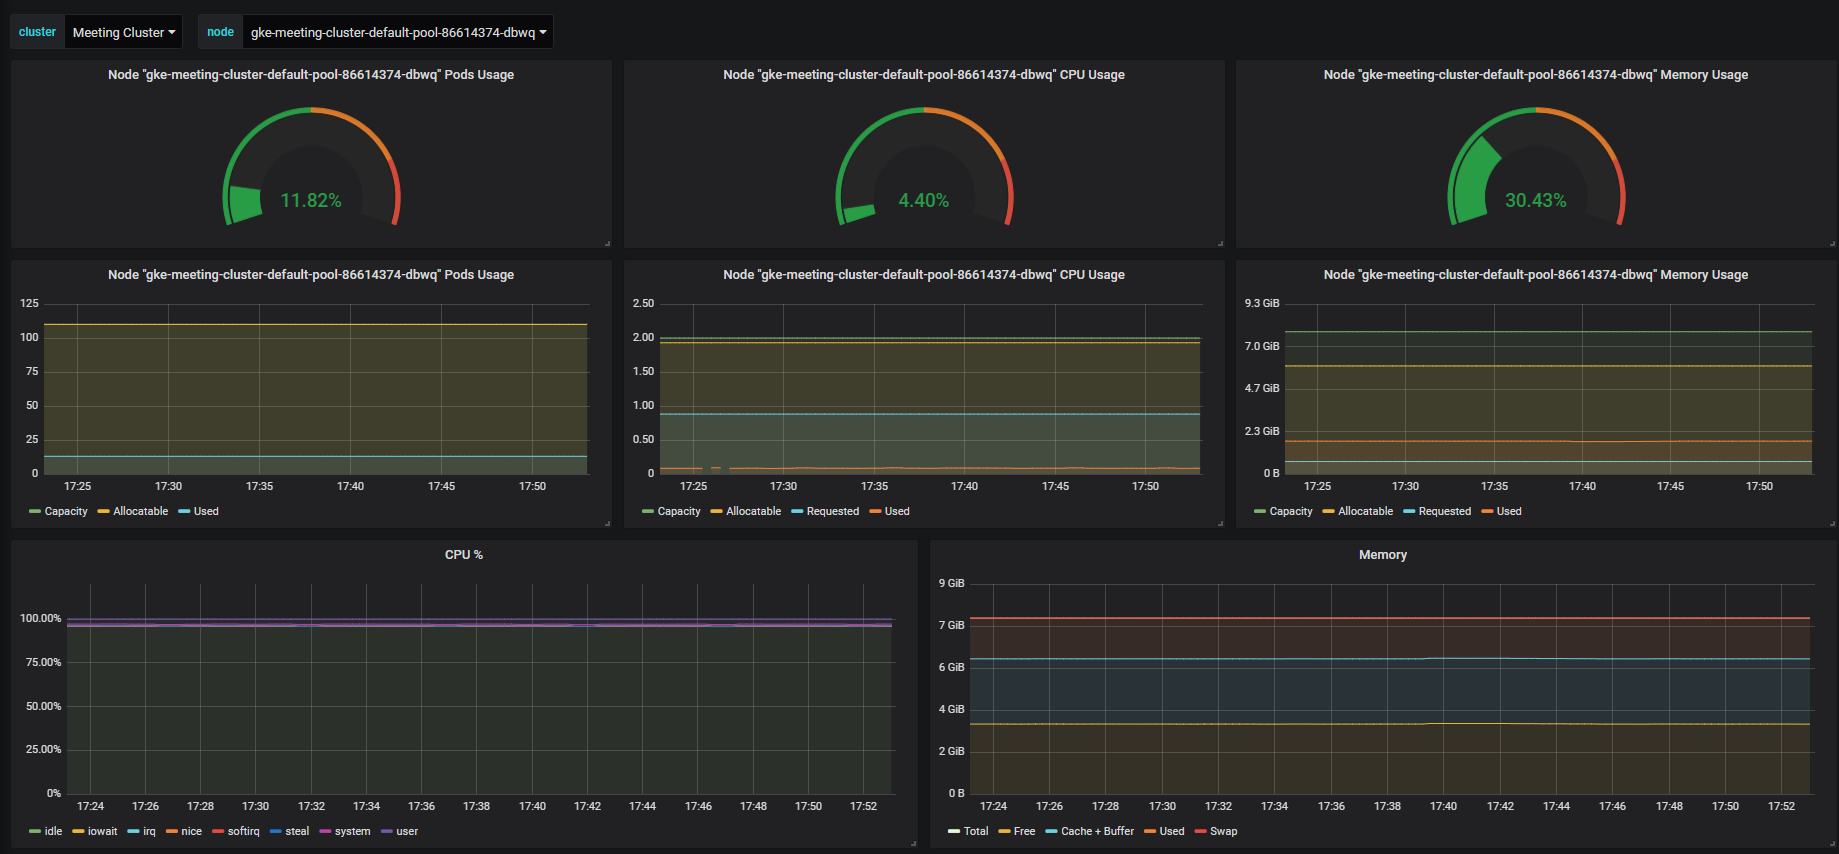
- Pod statistics and graphs
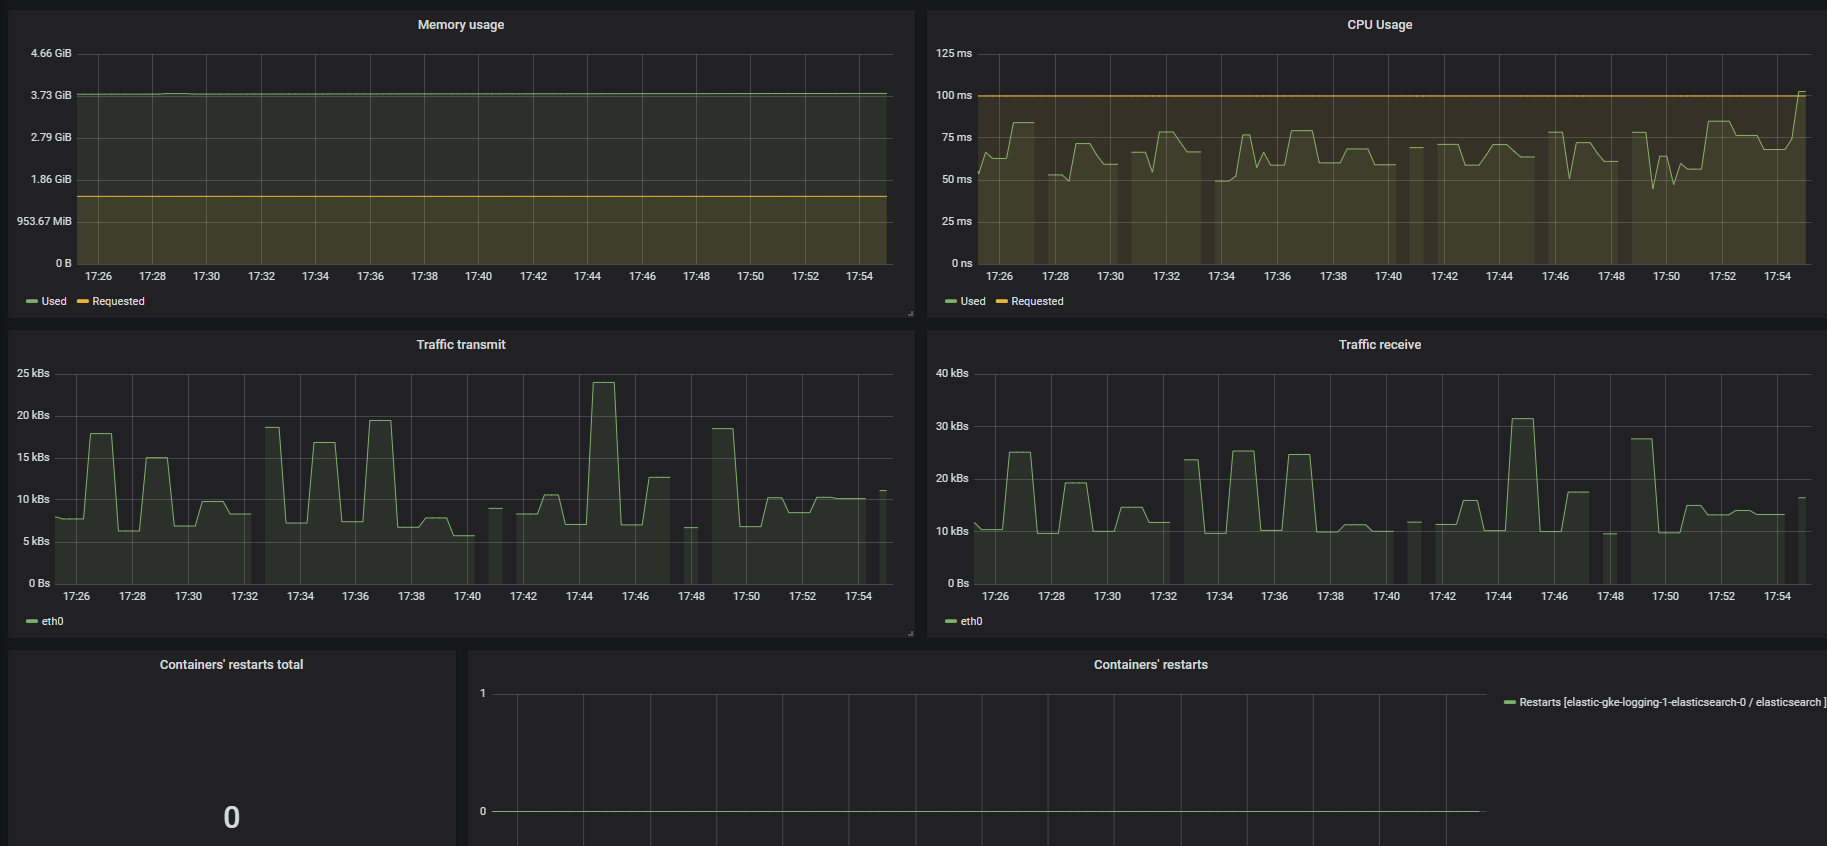
Deployment/Statefulset/Daemonset status with details about available replicas, container status, resources
- Node statistics
- App health status