Any modern technology-based business generates an enormous amount of data on a daily basis. This data might be clearly visible to decision makers or stay hidden from them. In any case, analyzing this data helps you see what's going on and make better decisions. Existing data analysis tools include business analytics platforms, machine learning tools, and AI-powered analytic tools.
To see and analyze your data, you have to fetch it from its source, process it, and put it in some data storage system first. This process is known as ETL — extract, transform, load.
Companies usually perform ETL using specialized software that allows for scaling in order to accommodate a growing volume of data. Processing large datasets requires a cluster that can run ETL processes in parallel with workloads adjusted to network, disk space and CPU capacities.
In this case, creating an ETL process from scratch isn't reasonable. It's easier to take a framework with embedded scalability, then supplement it by writing and debugging your own code that carries out data processing logic tailored to your requirements.
Why we recommend building ETL processes with CI/CD
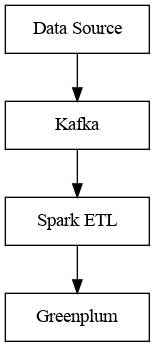
ETL incorporates several very different components: the data source, the method of data transportation, the processing logic, and the data storage.
In order to verify that the processing logic is working correctly, it is strongly recommended to test the data processing component together with the whole component chain (data extraction, transportation, processing, and storage)as opposed to testing it alone. In this case, it's very important that developers don't forget about any intermediate tests when checking their code for errors — otherwise, poor-quality code will make it to the production environment and cause problems that might be very difficult to fix.
That's why it's better to automate this process as much as possible so that the developers don't have to check all code changes manually. Without automation, overlooking errors is simply a matter of time.
Besides that, developers also need to have access to an environment with all the chain components that they might need to refer to when fixing errors. Given the diverse nature of the chain components and their scaling capabilities, it's difficult or outright impossible to deploy such an environment on a developer's machine.
CI/CD is a pipeline with consecutive phases that include building, testing, and deploying code and, later, code changes, in a production environment. CI/CD consists of two stages: continuous integration (CI) and continuous delivery (CD). At the CI stage, developers work on code, then it’s tested and prepared for the next stage. At the CD stage, the prepared code changes are deployed in the target environment.
Each step within this pipeline starts after the previous step has been successfully completed, and can be performed with various tools.
With a CI/CD pipeline, you can automate the steps that would benefit from it, and after these steps are completed, the pipeline deploys code changes in the testing environment. After code changes have been approved, they can be deployed to the production environment. This pipeline concept ensures that the requirements for the development of an ETL process will be fulfilled.
Tasks that require ETL
The success of a business that has deeply integrated IT into its structure depends on the efficiency of its data collection and data processing methods. Automation, monitoring, and prompt response are valuable in many industries — for example, manufacturing, service, and maintenance of smart infrastructures.
One of the tasks that make companies build ETL processes is data collection from IoT sensors. Collected data often has to be prepared in some way before it can be loaded into a storage system. This step is necessary because of the large volumes of collected data, the necessity to improve data quality in order to use it for machine learning, and the variety of data formats and the ways different IoT devices represent data. In the case of IoT, improving the quality of collected data and processing it are especially important.
Another good example of a task that requires ETL is collecting geolocation data from public transport vehicles with respective sensors (this might be a part of implementing a smart city project). In this case, analyzing geolocation data alone isn't of any use — it must be analyzed in the context of timetables, routes, employee work schedules, and other information that geolocation sensors can't provide. An ETL process lets you enrich collected data with additional information necessary for proper analysis.
Besides these examples, tasks that require an ETL process might arise in any type of business that relies on the results of data stream processing — and the overall number of such tasks keeps growing.
Transferring, processing, and storing data: Kafka, Spark, and Greenplum
There are many potential data sources, including information systems and environmental sensors. This means that data can be collected from various CRMs, EDM systems, financial services, and sensors in manufacturing facilities. Each data source can represent data in its own way and be geographically removed from the analytics server. This is why transferring and processing data is a necessary step.
Transferring data between different systems is a separate task that requires specialized solutions. One of the most popular existing solutions that lets you collect and transfer messages is Apache Kafka. It’s scalable, allows for regulating the throughput capacity by adding new nodes, and prevents data from being lost in transit by replicating it. So, we suggest using Apache Kafka for transferring data.
Processing data and implementing ETL processes can be quite resource-intensive operations, especially if you deal with large volumes of data. That's why a good data processing system should be scalable. One of the popular solutions that fit that requirement is Apache Spark. You can easily integrate it with Apache Kafka or other data sources. Apache Spark also has modules for additional data processing tasks, for example, MLlib for machine learning and GraphX for processing graphs, which helps with preparing data for analytics. So, in addition to Apache Kafka for transferring data, we suggest using Apache Spark as a data processing framework.
After transferring data, you need to put it in a long-term storage system. For storage, we suggest using Greenplum, which is a DBMS that can handle large volumes of data. This platform is based on PostgreSQL and allows for horizontal scaling of data storage servers. Thanks to its massively parallel processing architecture, Greenplum fits the requirements for working with machine learning, business intelligence, and other analytical tasks.
The three systems suggested by us — Kafka, Spark, and Greenplum — are open source, have served as a basis for some large software projects, and have general documentation and documentation for developers.
An infrastructure for CI/CDimplementation
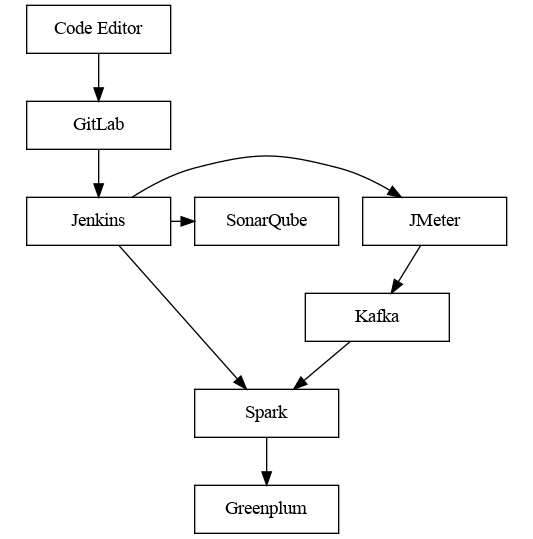
This data processing pipeline includes separate nodes for data generation, transfer, processing, and storage. Development and debugging of the data processing node might involve the other nodes as well, and there must be at least two separate environments in order to ensure a reliable development process. These two environments — the production environment and the stage/development environment — should consist of the same components, which helps you minimize any potential side effects and improve code quality. Automating deployment and testing also requires an infrastructure: a code repository, a build system, and systems for testing and static code analysis.
For software development teams, GitLab, a repository management system based on the Git version control system, is a well-established solution. It can be integrated with other CI/CD systems and also provides its own tools for implementing CI/CD. The wide range of accessible tools and modules lets you organize a convenient and flexible development process.
Organizing a process for building, testing, and deploying code is a separate task. There are several existing solutions for it, both proprietary and open source. A good choice is Jenkins, a popular and open-source system, which can be extended with additional modules and integrated with development and testing tools.
Errors in code can be avoided with automated source code checking — also known as static code analysis. It's recommended to implement it as a separate testing step in the build stage. Of all the static code analysis solutions out there, the SonarQube open-source platform seems to be the most suitable choice. It reviews code automatically, and if it encounters a potential error in a line of your source code, it adds a comment there. It can be integrated with Jenkins as a module, so any code changes that, according to SonarQube, contain errors can be discarded automatically, which improves the overall code quality.
Testing is a very important stage for verifying whether the data processing logic is correct. Unit tests, prepared in advance, help you check whether the business logic of your system works properly. Besides unit testing, integration and load testing can be useful as well, because these tests show how your system works in conditions similar to those of the production environment. A good tool for generating load and performing integration testing is JMeter, an open-source system. It can be integrated with Jenkins as a module and is suitable for assessing the performance of an ETL task.
The systems that we mentioned have web interfaces for visualizing the respective resulting information about builds and localizing errors quickly. We'll describe these systems in more detail below.
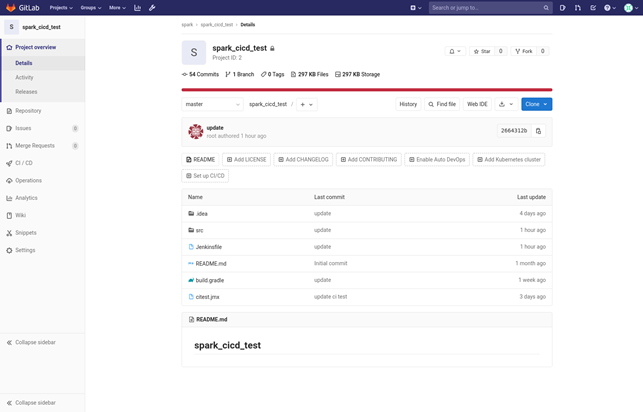
GitLab for managing code and repositories
GitLab is an open-source product, which is currently actively developed and maintained. According to its development team, GitLab is used by over 100,000 organizations, which is quite believable.
Thanks to being open source and providing maintained security mechanisms, GitLab is a good fit for a highly secure internal environment. GitLab supports two-factor authentication and single sign-on. Another advantage of GitLab is that developers who already store their projects in public repositories on GitHub can easily transition to using GitLab because of their similar interfaces.
GitLab offers different tools to make software development convenient and efficient: there are tools for issue tracking, planning, discussions, collaboration, and visualizing repository branches, and also a source code editor. You can find the full list of GitLab's features on the project's website. This platform also has a system of access privileges and repository user roles.
Jenkins for setting up a CI/CD pipeline
Jenkins is an open-source software development automation system. Currently this project is actively developed and maintained. Jenkins can be used in an internal highly secure environment thanks to being open source and providing security modules (similarly to GitLab).
You can use existing plugins to integrate Jenkins with other systems and also create new plugins to use in your own projects. There are over 1,500 plugins created by the Jenkinscommunity, which extend the platform's functionality and improve it in different ways — this includes fine-tuning UI and usability, supplementing Jenkins with additional build systems and deployment tools, and so on.
Thanks to its modular structure, a build and delivery pipeline in Jenkins can use different systems required in the software development process. The integration with GitLab provides automatic code change checking, which helps ETL task developers find potential errors quicker, and this lets them make ETL tasks more stable and effective.
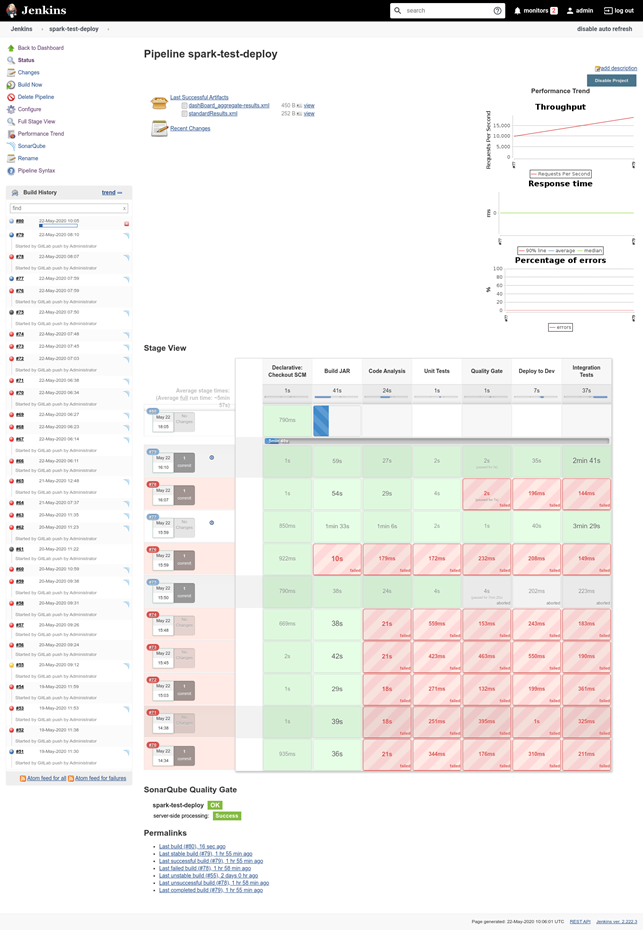
We suggest storing a configured CI/CD pipeline as source code, because developers can create pipelines for similar ETL tasks faster by using the existing pipeline code as a basis. Each pipeline stage is visualized in the web interface, so developers get feedback on the performance of each stage and can quickly localize potential issues.
SonarQube for static code analysis. Unit testing
In ETL task development, ensuring code quality is very important — when processing large volumes of data, the cost of an error can be very high. Corrupt data or lost data packets can decrease the overall quality of stored data, which then can't be used in analytics and loses its value.
Before starting the development of an ETL task, we recommend creating unit tests that cover edge cases, so that you can ensure proper implementation of the business logic. These tests will help you define the boundary conditions of your ETL task and avoid errors in its development. Unit testing is included in the CI/CD pipeline as a separate stage.
To check source code automatically, we use the SonarQube open-source platform. Like Jenkins and GitLab, SonarQube can be used in highly secure segments of a corporate network.
SonarQube integrates with Jenkins, so code can be built and then analyzed within a Jenkins pipeline. Based on the results of this analysis, the pipeline either moves on to the next stage or stops, and the code is sent back to the developers for fixing errors.
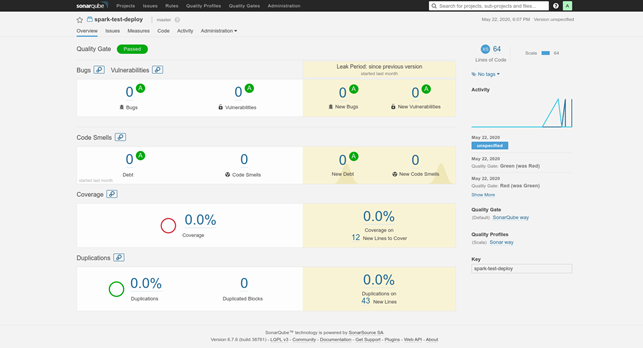
After analyzing the changes in the code of an ETL task, SonarQube generates a report on the quality of the code. This report shows where the tool found dead code, duplicate code, and potentially unsafe code. There's also an option to configure the tool by using specific rules that define code quality in your case.
JMeter for assessing the data processing capabilities of an ETL task
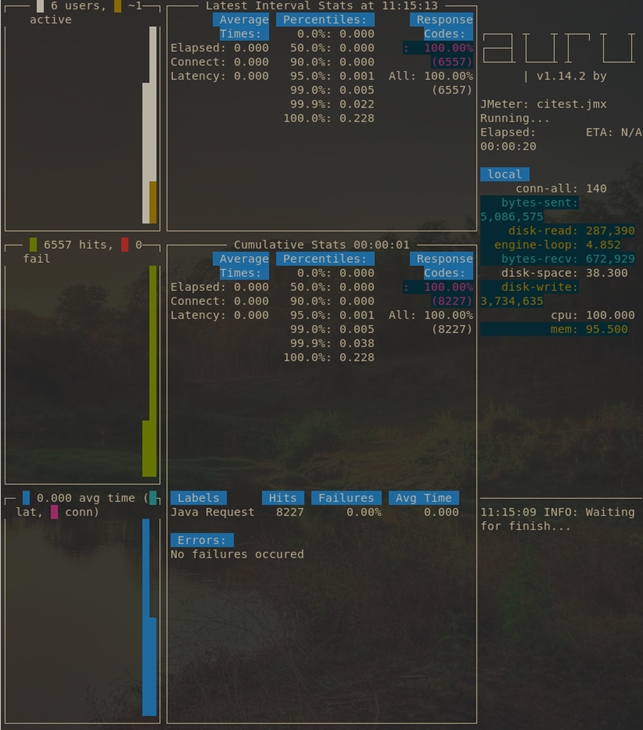
Besides checking the code quality of your ETL task, you also have to check how well it integrates into your data processing pipeline. In order to do that, you must create a load profile similar to what you expect in the node's regular operational conditions. You can also perform load testing with stress tests.
JMeter is an open-source tool that provides functionality for both integration and stress testing, so you can use it to assess the throughput capabilities of your system.
It integrates with Jenkins and can generate reports on the performance of the tested system. If you also use Apache Kafka to transfer data, reports can show you if there's a need to scale or reconfigure it. You can measure the throughput by adding debugging information into your data processing node or by sending analytical queries to your data storage.
It's recommended to make integration testing a separate stage in your CI/CD pipeline so you can identify any issues with the performance of your ETL task in conditions similar to those of your production environment.

Identifying potential issues found at different stages of the CI/CD pipeline
A CI/CD pipeline developed according to our recommendations lets you get debugging information from the software development automation system. After a developer implements some part of the business logic into the ETL task code, they can publish the code changes to the dev branch in their organization's Git repository. Then the CI/CD pipeline starts automatically building, testing, and deploying the published code changes.
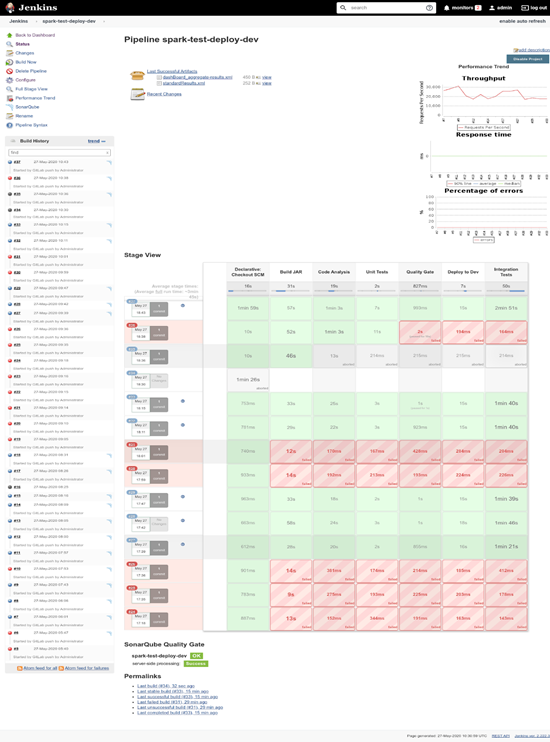
This pipeline makes it possible to quickly diagnose and localize infrastructure issues that hinder the performance of your ETL task. Below, we'll show you how to read a Jenkins report and, in case of a failed build, quickly figure out what the problem is.
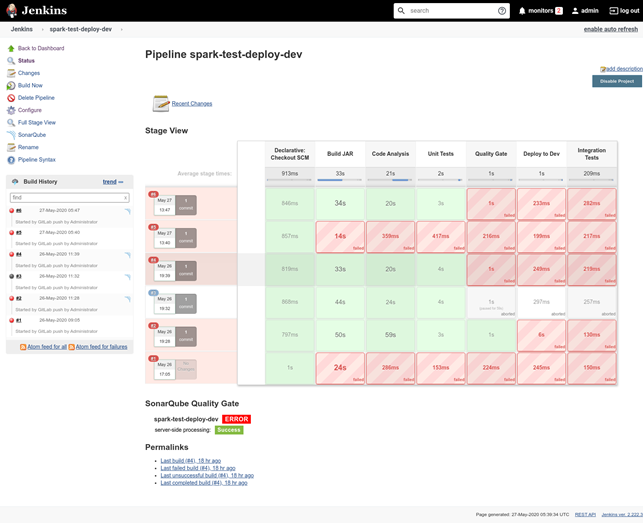
For example, in Figure 4, which illustrates how a Jenkins CI/CD pipeline works, you can see how the pipeline consecutively moves through the following stages:
1. Getting code from a repository
Errors at this stage can be caused by unavailable GitLab services. These types of issues don't have anything to do with the code itself, so they should be escalated to your infrastructure support service and DevOps engineers.
2. Building code
At this stage, you can identify issues with the building process: errors in source code syntax, missing packages, incorrect project structure, and any other issues that a build tool (such as Gradle, sbt, or Maven) can find. These issues are logged in the build history, and you can view them via the Jenkins web interface.
3. Starting static code analysis
Note:If the build tool starts static code analysis, then we recommend putting this stage after the build stage. You can also merge these two stages into one.
Errors at this stage can happen if static code analysis is performed before the build stage (see stage 2), and then issues arise at the build stage. If static code analysis comes after the build stage, issues may be caused by an unavailable SonarQube service. Just like at the first stage, such issues should be escalated to your infrastructure support service and DevOps engineers.
4. Performing unit tests
Errors at this stage are related to the business logic of your ETL task, so your ability to find these errors depends on the quality of your unit tests. Test results and errors are logged, and you can view them via the Jenkins web interface.
5. Assessing the results of the static code analysis using a quality gate configured in SonarQube
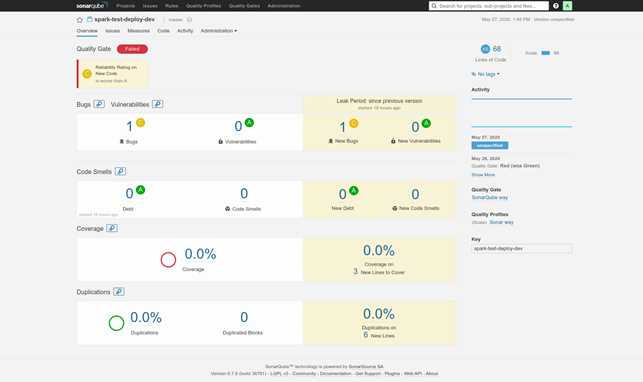
At this stage the static code analysis result is ready, and if the code doesn't satisfy your SonarQube quality requirements, you can view the result in the SonarQube web interface.
6. Deploying the application into an Apache Spark test cluster
Errors at this stage can be caused by not configuring deployments properly and providing the system with incorrect information. Another possible reason is that your Spark resources are unavailable. When developers can't fix such issues by themselves, the issues should be escalated to your infrastructure support service and DevOps engineers.
7. Performing load tests on the ETL task
Errors at this stage don't signify issues with the code — they usually indicate that the Apache Kafka cluster is unavailable. That's why, like in stages 1 and 3, such issues should be escalated to your infrastructure support service and DevOps engineers.
Only after all these stages have been successfully completed, you can verify whether your ETL task is working as expected. You can assess its stability, compliance with the business logic, and capabilities by examining its performance logs in the Apache Spark web interface. You can also add more stages for automatic business logic testing to your CI/CD pipeline if you need to. The pipeline that we suggest is a basic one and consists of the stages necessary for the development of any ETL task, so it doesn't include additional stages that might be required in your specific situation.

An example of a software development cycle based on our recommendations
With the infrastructure described above, companies can develop and test ETL tasks using a CI/CD pipeline. So, if we formalize our cycle for developing a stable ETL task, it will look like the flowchart below:
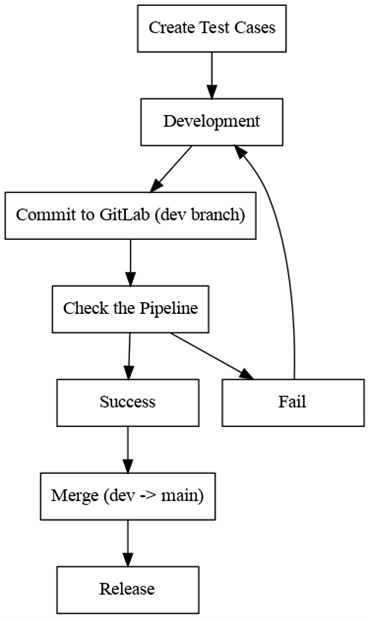
After you’ve decided what kind of ETL task you need, create tests for checking whether your ETL task works properly in terms of the business logic. If necessary, you can set up two build pipelines — one for a testing environment and one for the production environment. Use two branches in our GitLab repository: dev and main. Each branch is connected to the corresponding build pipeline: main to the one for the production environment, and dev to the one for the testing environment.
During development, developers commit code changes to the dev branch and, after they are automatically built, assess the code quality. This way, developers get quick feedback about potential issues. If there are no errors found in a build, the author of these code changes can push them to the main branch (if they have permissions to do that in GitLab). After that, the ETL task is built and deployed in the production environment.
Let's go through this process from a developer's point of view.
1. We change the source code of the ETL task (the testMethodForSonarQube method):

2. We commit our code changes to the dev branch:

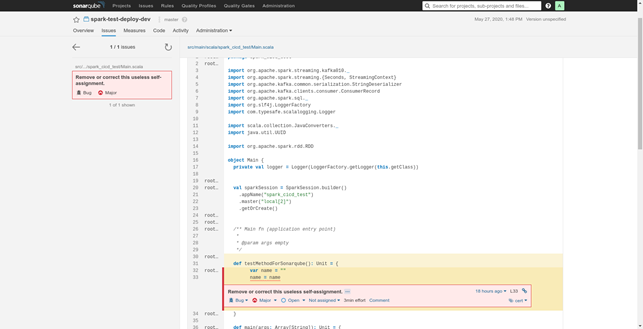
3. After the build process is finished, we can see the results — in this case, the static code analysis tool found an error:

4. We look at the static code analysis report and see what exactly we need to fix and where it is:
5. After fixing the issue, we get a successful build. At this point, we can consider using this ETL task in the production environment:
Conclusion
As we've shown above, the development of an ETL task can be simplified by using automation and a CI/CD pipeline for building, testing, and deploying code.
A CI/CD pipeline can be based on open-source software, which makes it possible to use these systems in highly secure segments of a corporate network. Some components of this architecture (Jenkins, GitLab, and SonarQube) also have built-in security mechanisms.
All the recommended components easily integrate with each other. This architecture can also be extended with other systems (for example, BI and/or ML tools).
Automation and the approach suggested by us can help companies transform their business processes and make them more flexible by improving code quality and accelerating their ETL task development cycles. By following our recommendations, organizations can quickly and routinely get even more information from new data sources.
