
Over the course of the last few years, time series databases have evolved from a rather uncommon tool (intended for special purposes and used either in big data projects or in open-source monitoring systems, in which case it was bound to specific solutions) into a more conventional one. Previously, if you wanted to store a lot of time series data, you had two options: resign yourself to deploying and supporting the complex monstrosity that is the Hadoop stack, or deal with protocols specific to each system.
Some might think that any recently written article about choosing a TSDB should essentially be just one sentence: "Use ClickHouse." But it's not that simple, actually.
Yes, ClickHouse is being actively developed, its user base is growing, and the project is supported by many enthusiastic developers. But could it be that the apparent success of ClickHouse has blinded us to the potential of other (perhaps more effective or reliable) solutions?
In the beginning of 2018, we started overhauling our own monitoring system, and we faced the issue of choosing an appropriate database for storing our data. Now I want to share with you how we made that choice.
Defining the requirements
Let's start with a little preamble. Why did we need our own monitoring system and how did we set it up?
We started to provide IT support services in 2008. By 2010, it was obvious to us that aggregating data about the processes in a customer's infrastructure by using the solutions available back then had become too difficult (I mean Cacti, Zabbix, and Graphite, which had been released not too long before).
Our main requirements were:
● a single system with the capacity to support at first dozens and eventually hundreds of customers, at the same time providing centralized notification management;
● a flexible notification management system, allowing us to escalate notifications from one employee to another, adapt the system according to the team's schedule, and access a knowledge base;
● the capability to create detailed interactive charts (back then, Zabbix generated graphics in the form of images);
● long-term (one year and longer) storage of large volumes of data and a fast data fetching mechanism.
In this article I'll focus on the last requirement.
This is what we wanted from our storage:
● it must be fast;
● preferably with an SQL interface;
● must be stable, with an active user base and ongoing input from developers (we once had to maintain MemcacheDB, which had been practically abandoned, and MooseFS, where bugs were submitted in Chinese. We don't want to repeat that experience.);
● should belong to the CP category of the CAP theorem: it must provide Consistency (our data must always be up-to-date, because we don't want the notification management system to send alerts to all projects when it doesn't receive new data) and Partition Tolerance (we don't want any split-brain issues). Availability is not a priority if we enable active replication — in case of emergency, we can manually switch to the redundant system through code.
Surprisingly, the best option for us back then turned out to be MySQL. Our data structure was very simple: the server id, the counter id, the timestamp, and the value. We could fetch both hot and historical data quickly due to the large size of the buffer pool and the speed of SSDs.
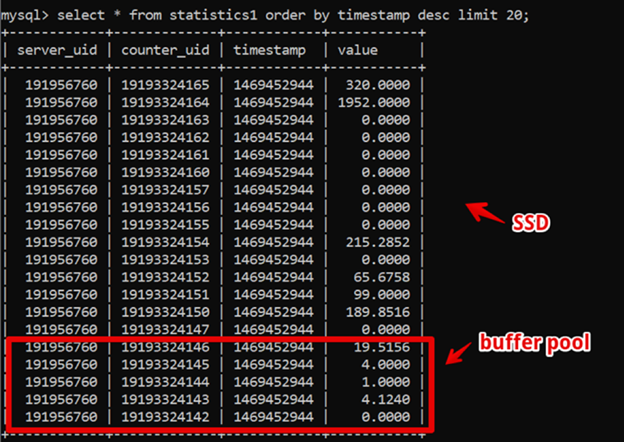
This way, fetching new, two-week-old data where the time is detailed to seconds and displaying it completely took 200 ms. After we managed to achieve this, we were happy with our system for a while.
But as time went by, the volume of our data grew. By 2016, it amounted to tens of terabytes, so renting SSD storage became quite costly.
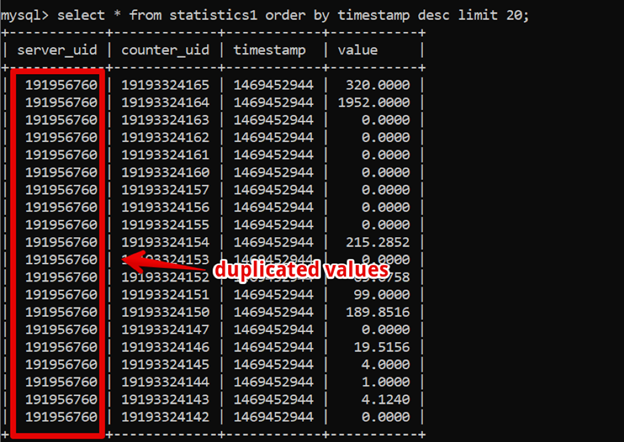
By that time, columnar databases had gained popularity, and we started considering that option. In this type of database, data is stored, obviously, by column, and as you can see in the picture below, our data tables included many duplicate values — if we used a columnar database, they would be compressed into a single item.
However, the existing system was business-critical and stable, so we didn't feel inclined to experiment with other solutions.
It was probably at the Percona Live Conference 2017 in San Jose where the Clickhouse developers introduced their project to the world. At first glance, the system seemed to be production-ready, maintaining it was easy and didn't take much time, and operating it was simple as well. That’s why, starting in 2018, we began our migration to Clickhouse. However, many mature and established TSDBs had appeared by then, so we decided to take more time and compare all the options in order to make sure that Clickhouse was the best choice for us.
Besides the previously mentioned requirements, we now had some new ones:
● our new system should be at least as efficient as MySQL on the same amount of hardware;
● the storage should take up less space than that of the existing system;
● the DBMS should be easy to use;
● switching to the new system shouldn't require making too many changes to our monitoring application.
Here are the systems we were considering:
Apache Hive/Apache Impala
A part of the old tried-and-true Hadoop stack. Essentially, it’s an SQL interface on top of data stored in its own file formats in HDFS.
Advantages:
● If you maintain it properly, scaling is easy.
● You can store data in a columnar format, which saves space.
● Parallel tasks are finished very quickly provided that there are enough computing resources.
Disadvantages:
● Being a part of the Hadoop ecosystem results in operational difficulties. If you're not ready to buy a ready-made cloud solution (which we considered too expensive), your administrators will have to put the whole stack together and maintain it themselves. We didn't want that.
● Yes, the speed of data aggregation is good.
However:
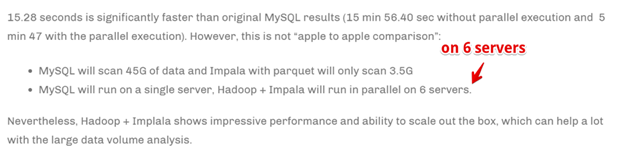
As you can see, this speed is achieved through adding more computing servers. In other words, if we were a large data analytics company, and a very high speed of data aggregation was a critical business requirement (even if we had to pay for a large amount of computing resources), Apache Hive/Apache Impala could be a viable option. But we weren't ready to drastically increase the amount of hardware for the sake of speed.
Druid/Pinot
This option is more along the lines of a time series database, but still associated with Hadoop. Here’s a great article comparing Druid, Pinot, and Clickhouse.
In a nutshell, Druid/Pinot are better than Clickhouse when:
● Your data is heterogeneous (in our case, however, we only recorded time series of server metrics, which comprise, essentially, a single table. However, there might be other use cases where we need to aggregate and process different time series with different structures: time series of hardware metrics, economic time series, and so on).
● At the same time, there is a lot of data.
● Tables and data including time series are not permanent (meaning that data sets are added, analyzed, and then deleted).
● There are no clear-cut criteria for data partitioning.
If none of the above applies to your situation (as in our case), you'd be better off with ClickHouse.
ClickHouse
● An SQL-like syntax.
● Easy to use.
● People say that it works for them.
So, it became a shortlist candidate.
InfluxDB
This is an alternative to ClickHouse. One of the downsides is that only the paid version provides high availability functionality, but we included it in the comparison anyway.
It became a shortlist candidate.
Cassandra
On the one hand, we know that such monitoring systems as SignalFX and OkMeter use it for storing time series of metrics. On the other hand, it has its specifics.
Cassandra isn't a conventional columnar TSDB. It looks more like a row database, but each row can have a different number of columns, so you can arrange your data to be represented in a columnar format. The 2 billion column limit allows for storing some data (like time series) specifically in columns. In MySQL the limit is 4096 columns, so if you try to do the same using MySQL, you're very likely to get a #1117 error.
The Cassandra engine is intended for storing large volumes of data in a distributed system without a master node. This database falls under the AP category of the CAP theorem, so it’s oriented towards availability and partition tolerance. As a result, Cassandra is a great tool if you mostly need to write to your database and read data from it only on rare occasions. It would make most sense to use Cassandra as cold storage — that is, as reliable long-term storage for large sets of historical data that you don't utilize very often but can fetch when necessary. However, we included it in the test to make it more comprehensive. There were some limitations, because, as I mentioned before, we didn't want to rewrite too much code to accommodate the new database solution, so we didn't adapt the structure of our database to Cassandra.
Prometheus
Out of curiosity, we decided to test Prometheus as well, so that we could see whether existing solutions were faster or slower than our own monitoring system.
Our testing methodology and test results
We tested 5 databases with 6 configurations: ClickHouse (1 node), ClickHouse (a distributed table stored across 3 nodes), InfluxDB, MySQL 8, Cassandra (3 nodes), and Prometheus. Our test plan ran as follows:
1. upload historical data collected over a week (840 million values per day, 208 thousand metrics);
2. generate a workload: continuously insert new data into the tested system (we tested the systems in six load modes, which you can see in the picture below);
3. besides inserting data, we also fetched data from time to time in order to simulate the actions of a user working with charts. To make things simpler, we were fetching data on ten metrics (the number of metrics in the CPU chart) collected over the course of a week.
So, we started inserting data, simulating the behavior of our monitoring agent, which sends values for each metric every 15 seconds. At the same time, we alternated between:
● the overall number of metrics where data is inserted;
● the time interval between sending data for the same metric;
● the batch size.
Now, a few words about the batch size: since individual inserts are not recommended for any of the tested systems, we need an intermediary that collects incoming metrics data, groups it and inserts it into the database in batches.
To make data interpretation easier, we'll think of this bunch of metrics as if they were organized by servers — 125 metrics per server. We’ll do it simply to illustrate that, for example, 10,000 metrics would correspond to 80 servers.
So, keeping all that in mind, here are our six load modes for inserting data into the database:
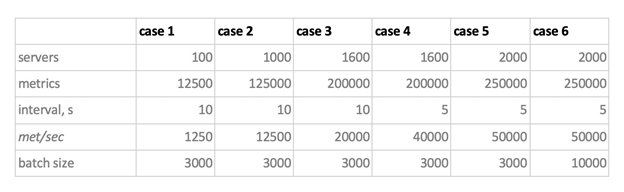
A couple of things to note. First of all, Cassandra couldn't handle these batch sizes, so we limited them to 50 and 100 metrics. Secondly, since Prometheus uses the pull model, that is, it pulls data from the sources of the metrics (and even Pushgateway doesn't change the situation, despite what its name might suggest), we used a combination of static configs when generating the workload.
Here are the test results:
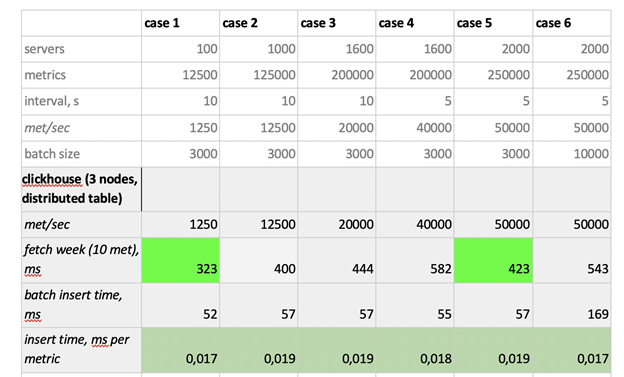
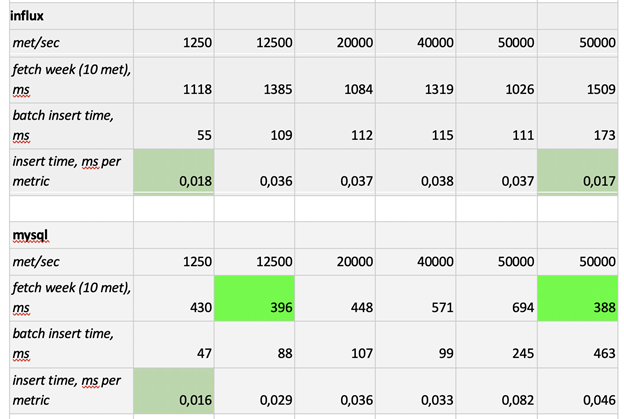
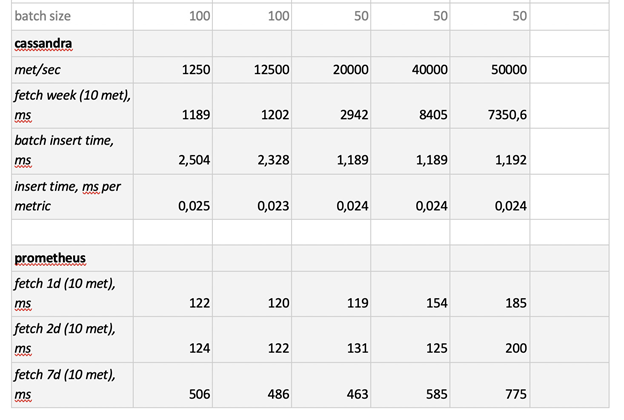
As you can see, Prometheus can fetch data exceptionally quickly, Cassandra is horribly slow, and InfluxDB is way too slow. As for the insert speed, Clickhouse comes out on top, and we can't really test Prometheus because it inserts data within itself, so we can't measure the insert speed the same way as for the other systems.
All in all, ClickHouse and InfluxDB showed the best results, but building an InfluxDB cluster would require buying its Enterprise version, while ClickHouse is free. So, while many companies favor InfluxDB, we will stick to ClickHouse.